Our approach to conservation is ecosystem-based.

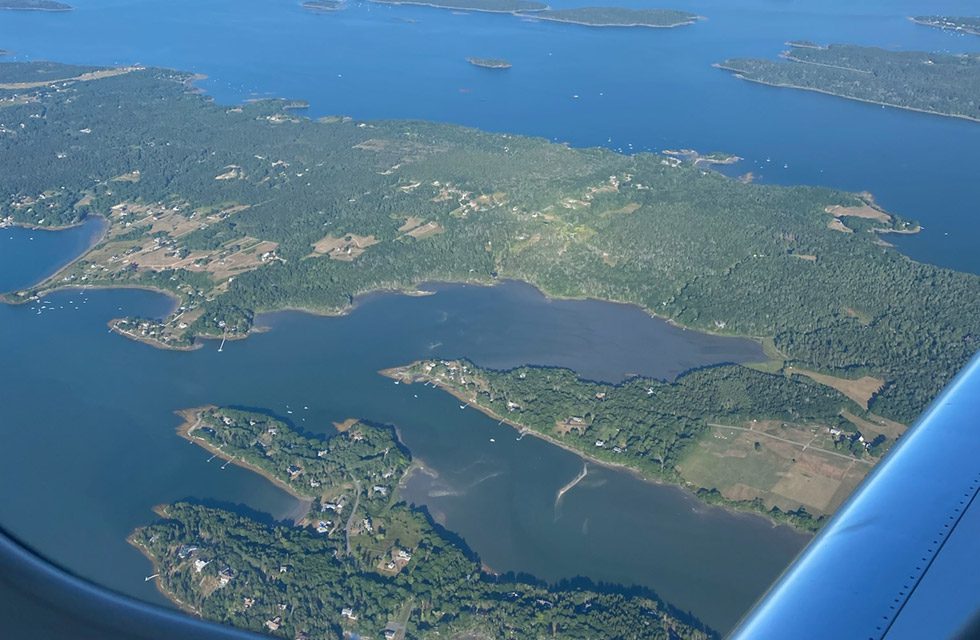
Tracking the health of Quahog Bay

Creating a market for the invasive green crab

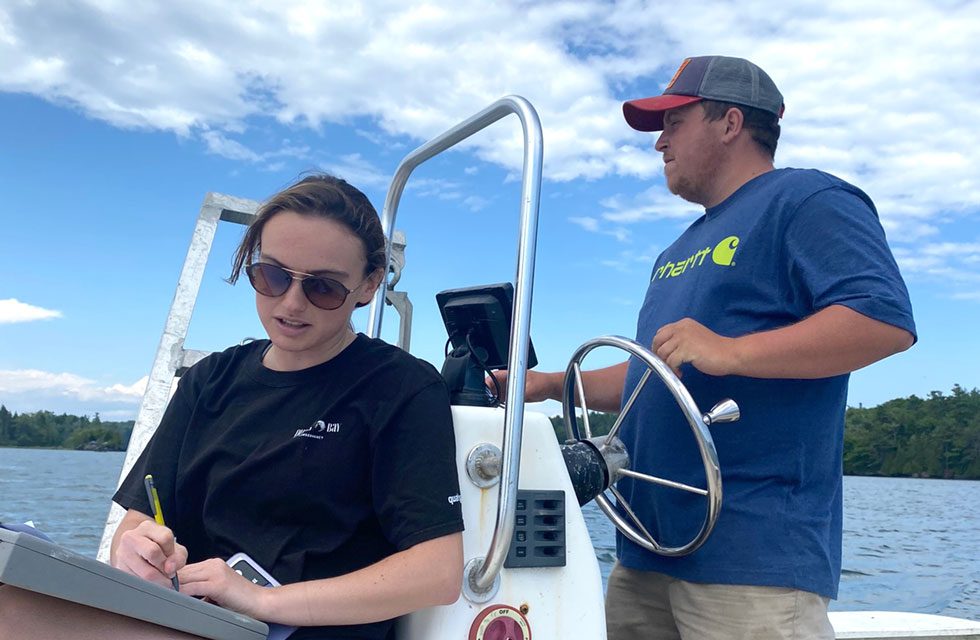
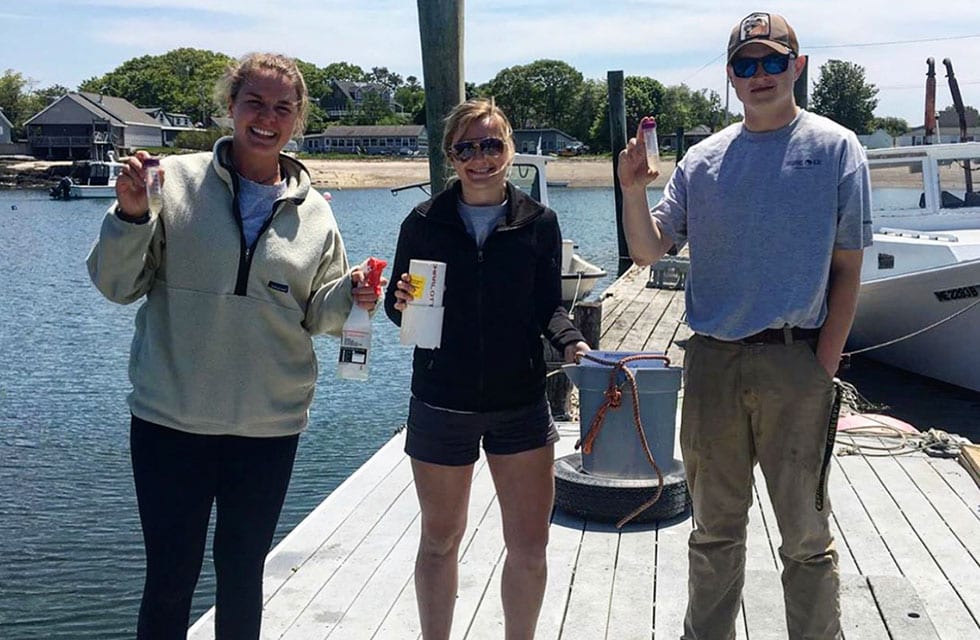
WATER QUALITY MONITORING

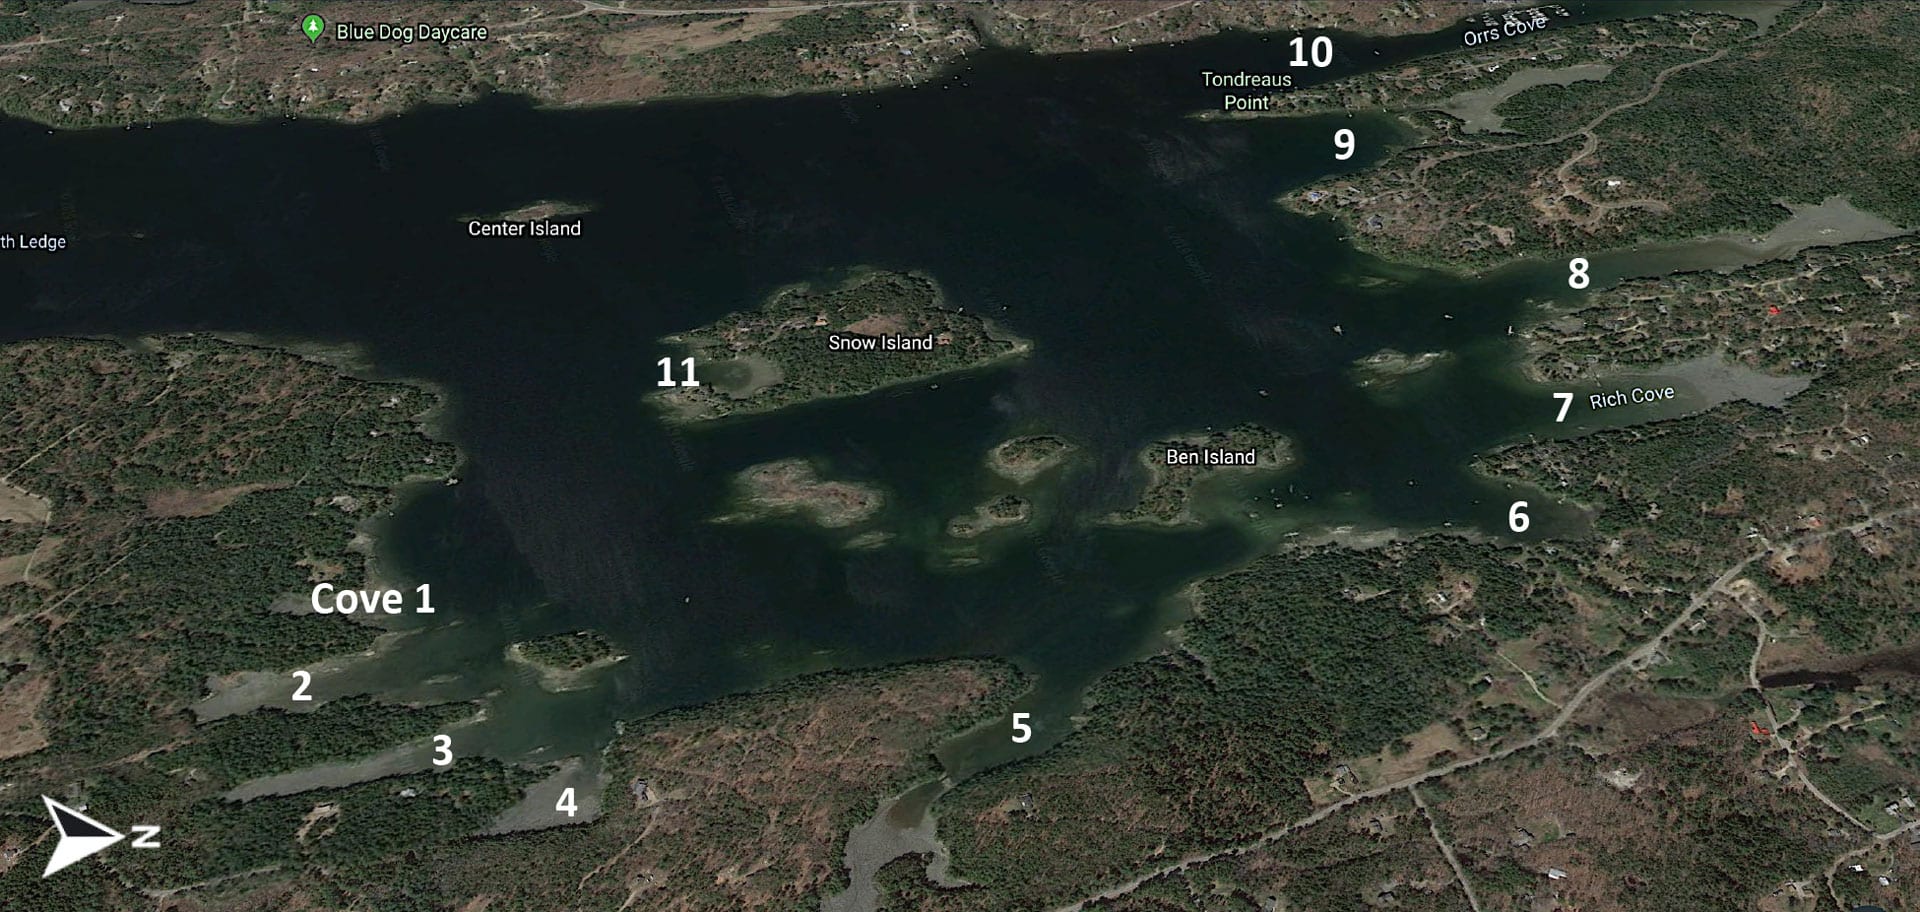
Water Quality Monitoring Sites


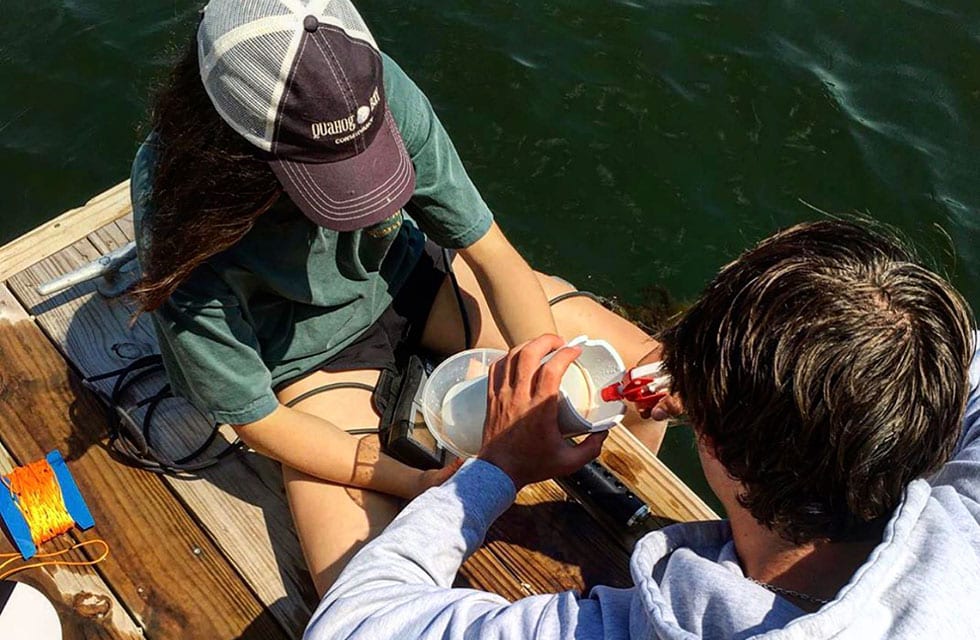
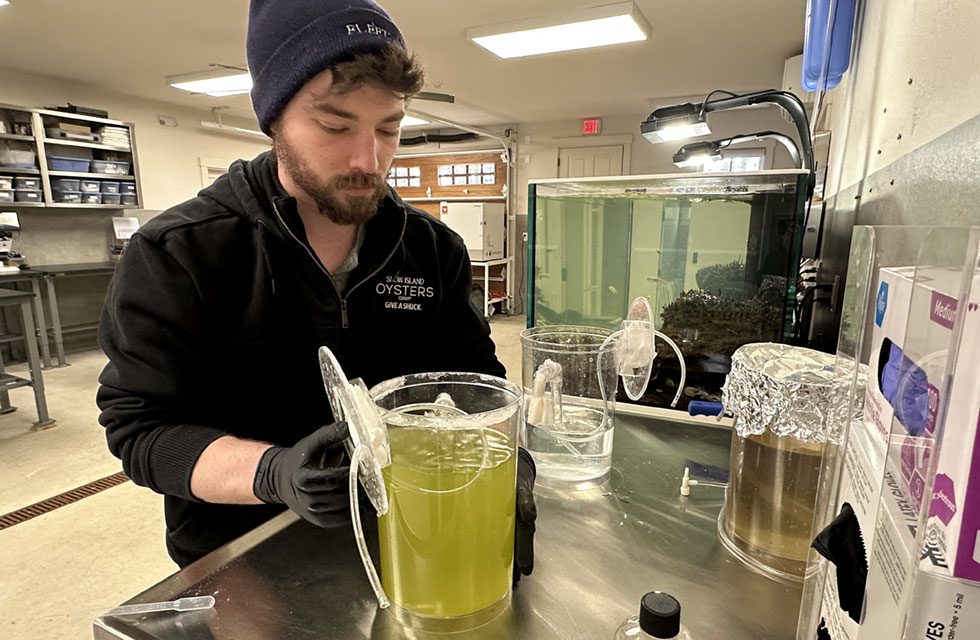
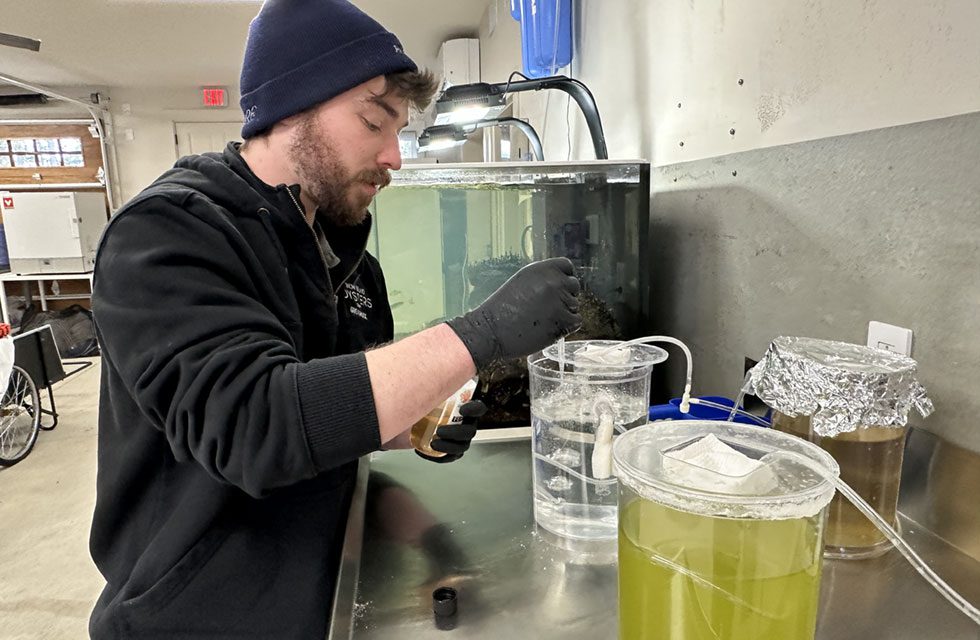
Each week, the QBC team collects water samples at nine different sites in Quahog Bay. Data is collected from the surface waters at each location and then processed and analyzed in our lab. We collect measurements of temperature, salinity, pH, and dissolved oxygen. In addition, we monitor levels of bacteria and various species of phytoplankton in order to track harmful algal blooms (HABs), more commonly known as “red tide” (see below for more information).
What do these measurements tell us about water quality?
Temperature – Research has shown that the Gulf of Maine is warming 99% faster than any other world ocean. We collect temperature data in Quahog Bay to monitor local trends and the seasonal turnover of the water column.
Salinity – Salinity is the amount of dissolved salts in water. On average, the salinity of seawater is 35 parts per thousand (ppt), meaning there are 35 grams of dissolved salts in every one liter. Freshwater has a salinity of 0 ppt. After a heavy rainstorm (a large freshwater influence), we often observe lower salinity values in the surface waters.
pH – The scale by which “acidity” is measured. Acidity indicates the concentration of hydrogen ions in a liquid. Biological, physical, and geological processes all naturally affect acidity levels, but human influences such as CO2 pollution can also impact ocean pH. A drop in pH indicates an increase in ocean acidity, which can affect shellfish by inhibiting calcification (skeleton/shell building).
pH scale with examples of common solutions and their pH values (NOAA)
Dissolved Oxygen (DO) – The amount of oxygen present (dissolved) in water. All aquatic animals need DO to breathe. Lower oxygen levels often occur in bottom waters where organic matter is decomposing and microorganisms are consuming DO. DO levels below 3 milligrams per liter (mg/L) raise concern for poor water quality that cannot sustain many species of marine life.
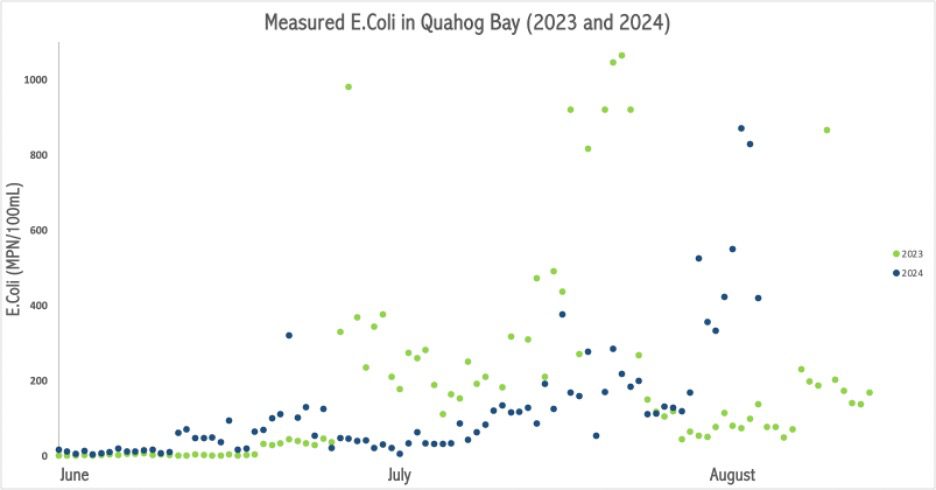
Bacteria – Bacteria are a natural part of microbiology. We test for the presence of disease-causing organisms or pathogenic bacteria, which indicate that the water has been contaminated with the fecal material of humans or other animals.
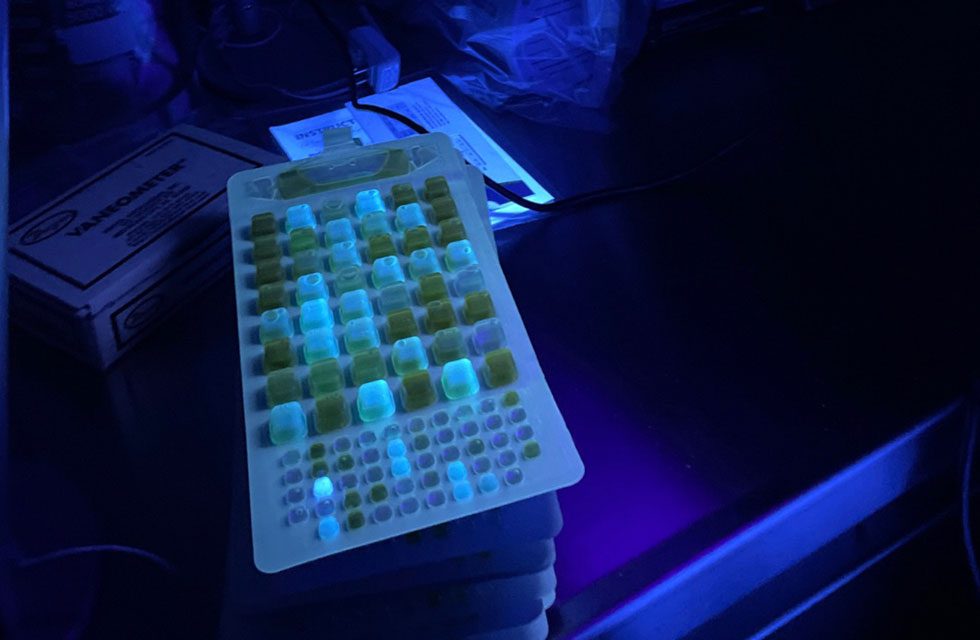
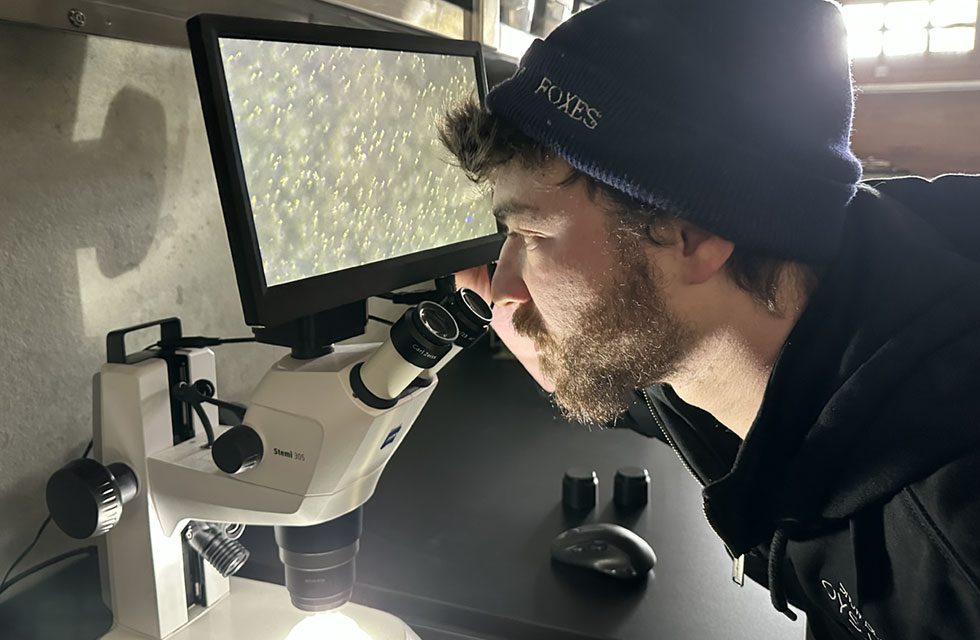
Phytoplankton – Phytoplankton are the foundation of the marine food web. Cell counts of different species of phytoplankton inform us about the abundance of each species in the seawater. Many species bloom in the spring and fall, but some are toxic to humans and have been categorized as harmful algal blooms (HABs) and/or red tide (see below for more information).
Red Tide – Maine’s “red tide” is monitored by The Marine Biotoxin Monitoring Program which is administered by the Department’s Bureau of Public Health. It uses the standards outlined in the National Shellfish Sanitation Program (NSSP) to monitor levels of PSP (“Red Tide”) and other marine biotoxins in the shellfish of the State of Maine and is regularly checked to prevent any shellfish illness.
For more information from the Department of Marine Resources concerning Marine Biotoxin Monitoring, visit their website: https://www.maine.gov/dmr/
We maintain vigilant oversight across all nine sites as part of our ongoing commitment. Since the inception of the Quality Monitoring Initiative in 2019, our efforts have been multifaceted:
- We diligently track and analyze trends, ensuring a comprehensive understanding of the evolving landscape.
- Leveraging the wealth of data at our disposal, we actively support and contribute to various projects, enriching our collective knowledge base.
- A dedicated focus on enhancing the continuity of data during the off-season underscores our commitment to thorough, year-round monitoring.
- Excitingly, we anticipate the integration of weather stations in the near future, a strategic move to further fortify our monitoring capabilities. This innovation is poised to elevate our ability to gather crucial insights and sustain our commitment to excellence in data-driven decision-making.
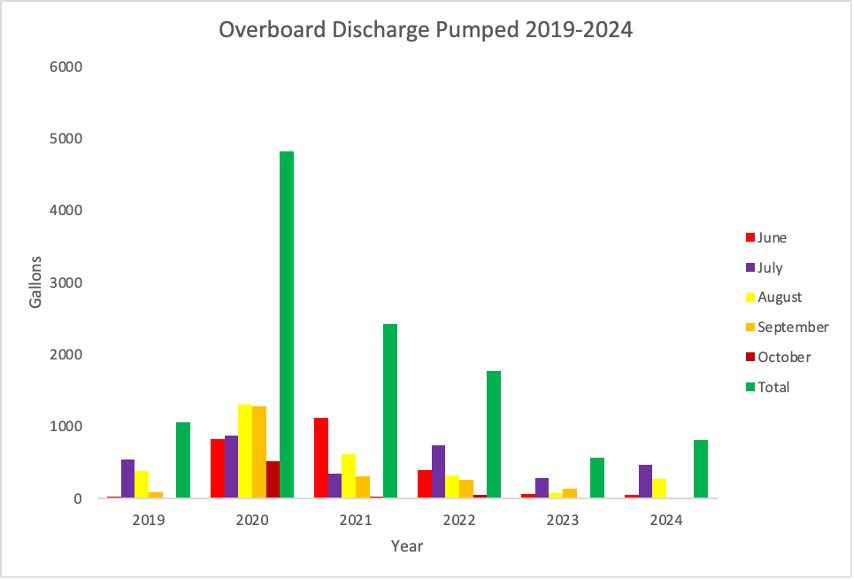
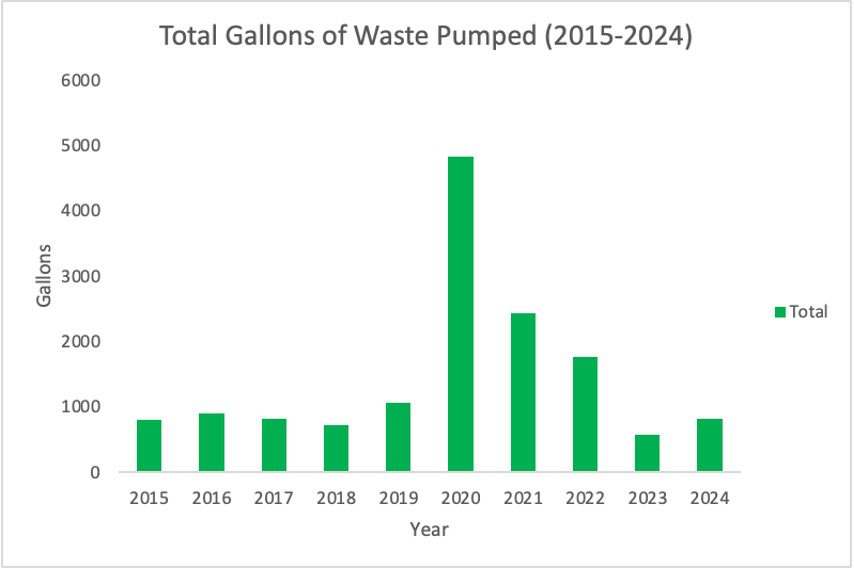
Total pumped 2015-2024= 14,713.2 gallons
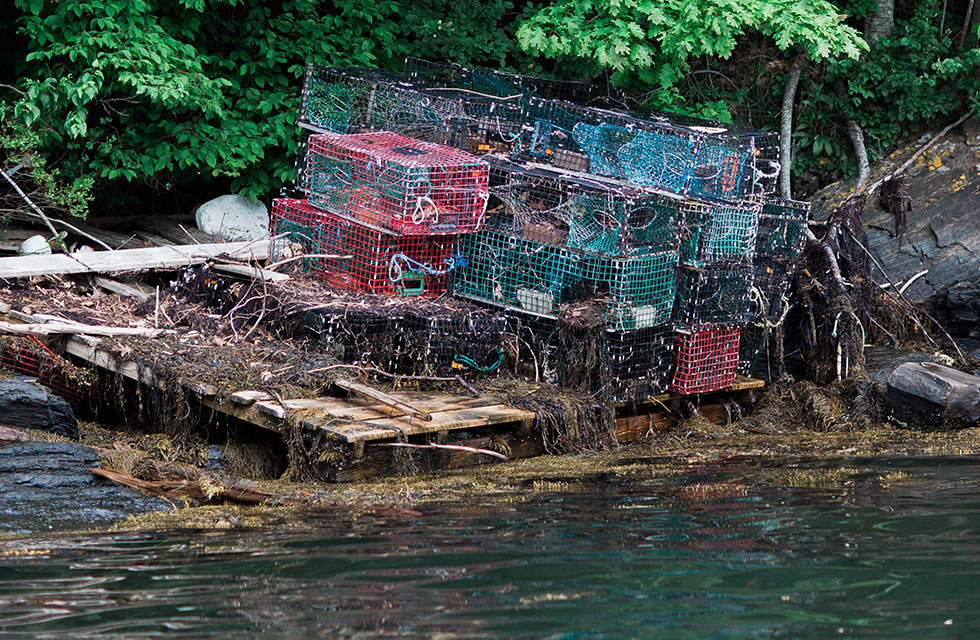
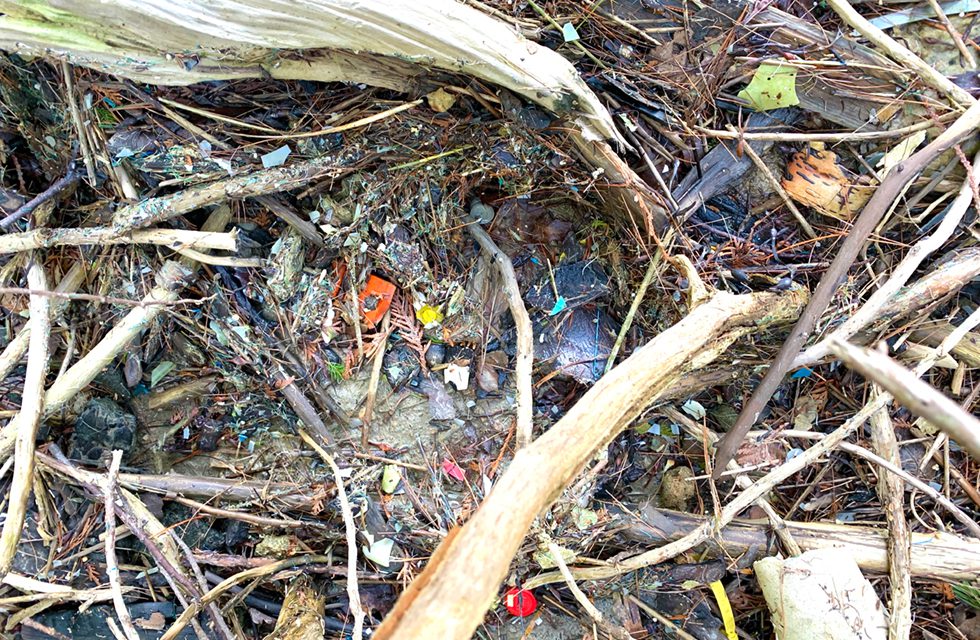
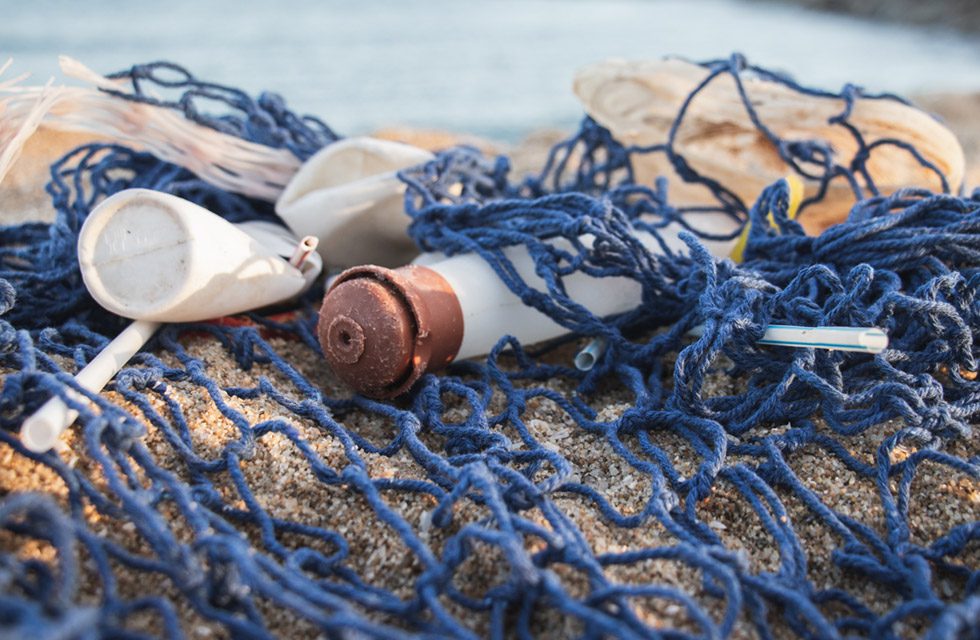
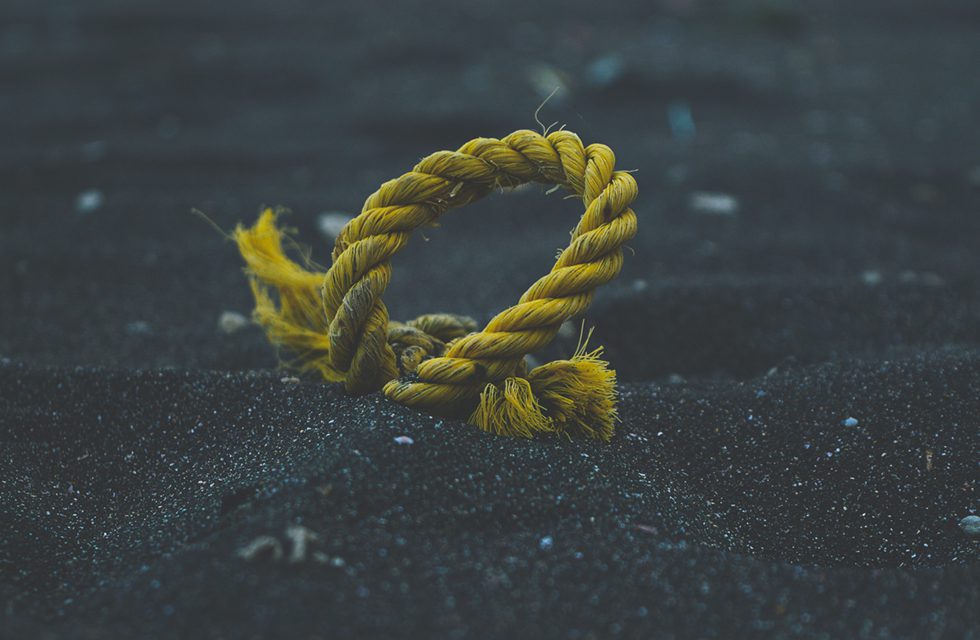
MARINE DEBRIS REMOVAL
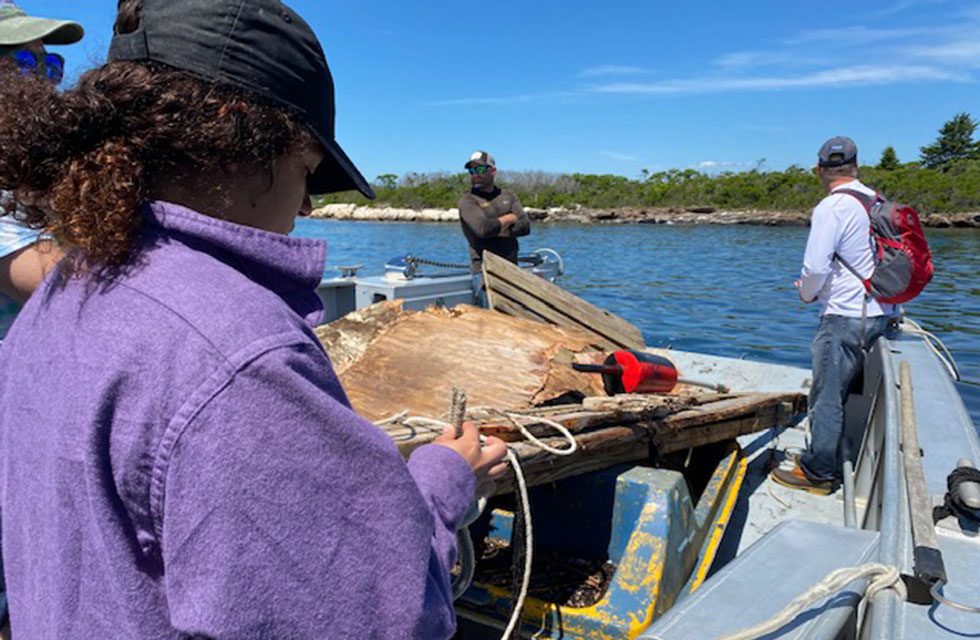
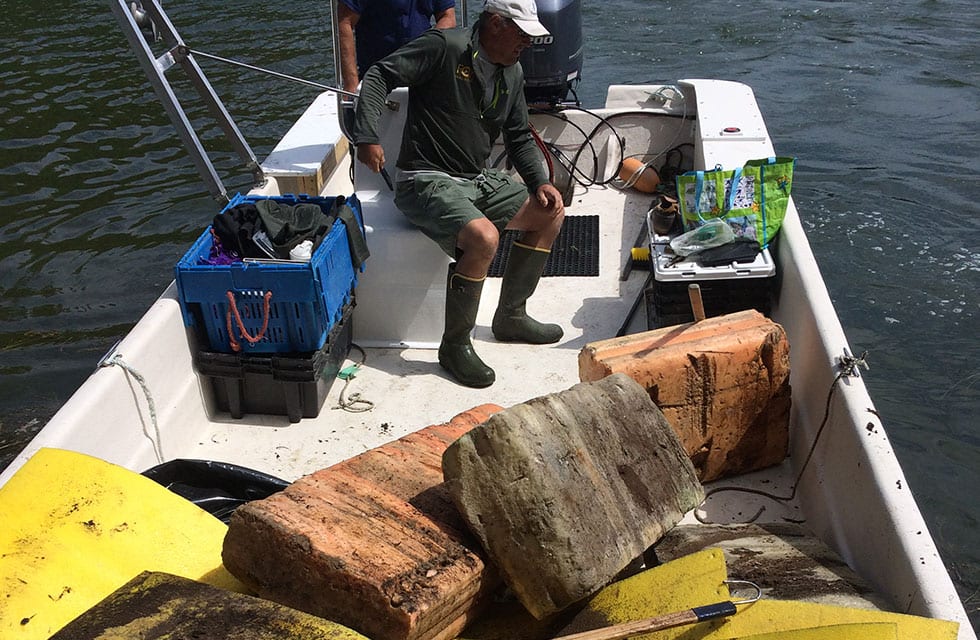

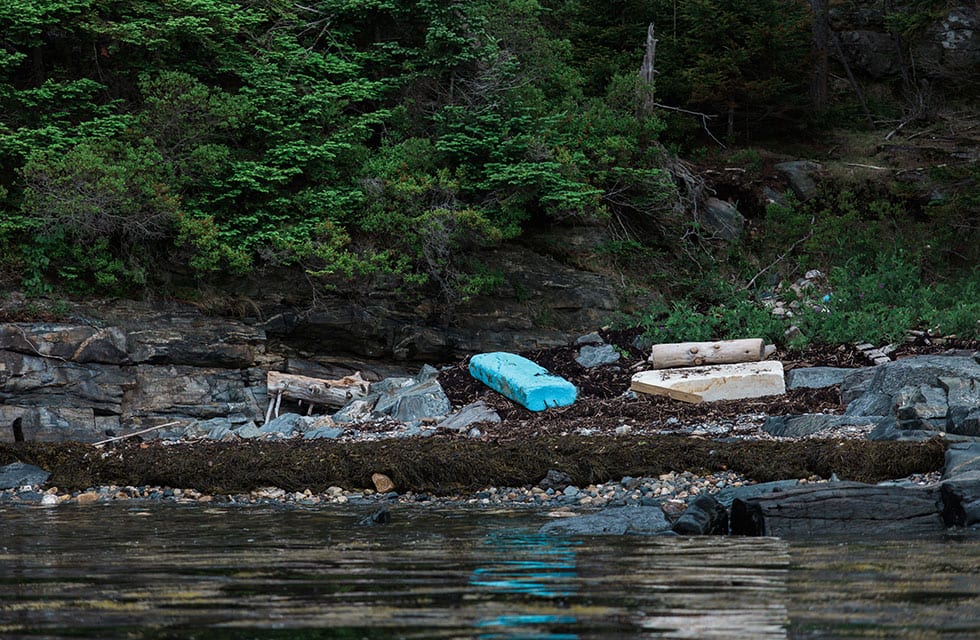
Yearly QBC patrols and removes marine debris on the bay and along the shoreline. We also partner with other organizations and companies who have the same philosophy to maintain and protect the natural environment.
QBC partnered with Patagonia (Freeport) employees as well as participated in DMR’s Maine Coastal Cleanup to remove marine debris.
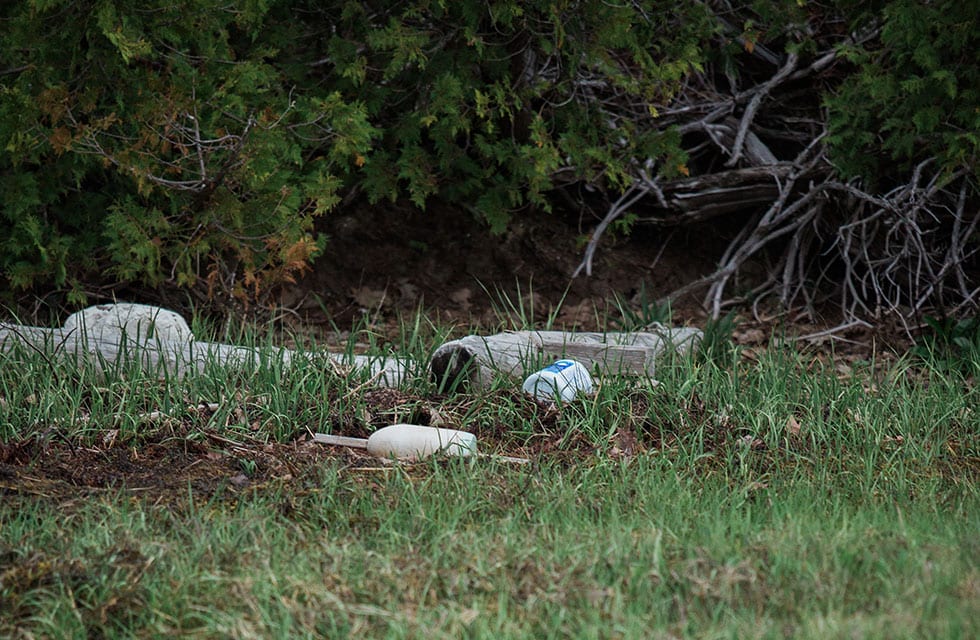
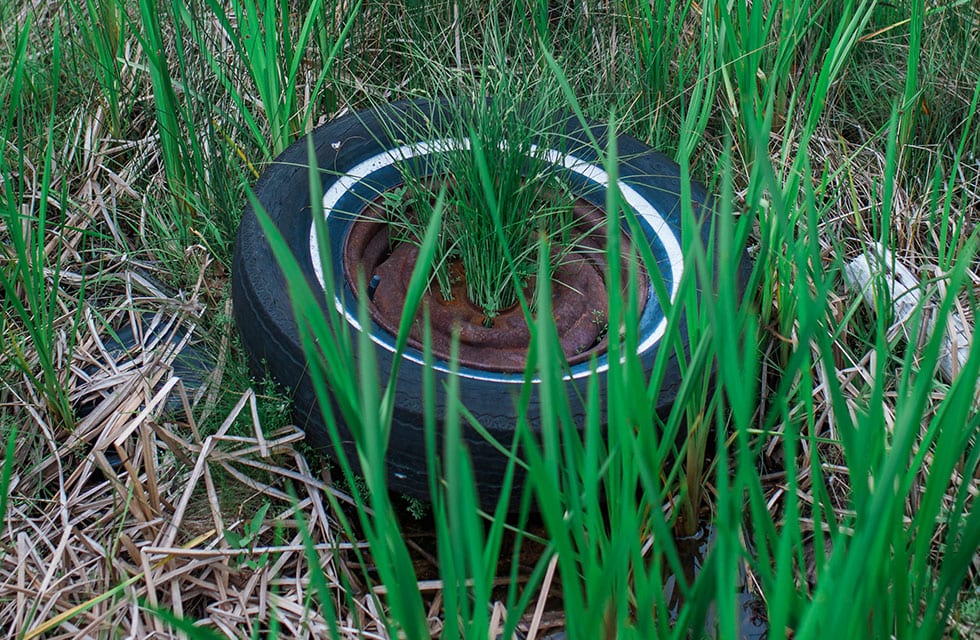
Types of debris eliminated from the bay:
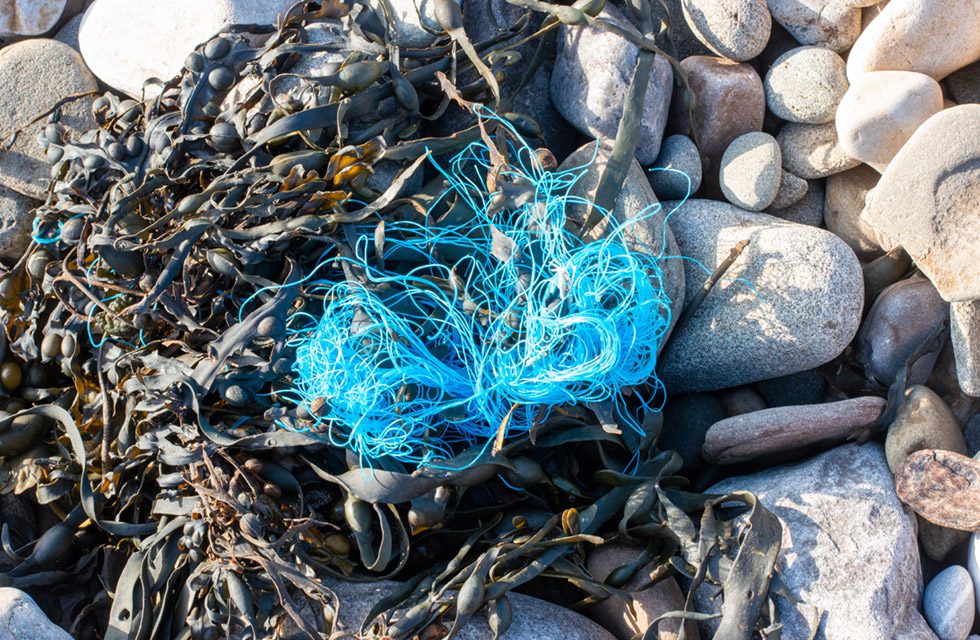
- fishing gear
- car batteries
- plastics
- rope
- cigarette butts
- styrofoam
- rubber gloves
- bottles & cans
- party balloons
- tires
- derelict docks & parts
- dock debris
QBC conducts year-round patrols to remove marine debris from the bay and along the shoreline. We also collaborate with like-minded organizations and companies to help preserve and protect the natural environment.
Recently, QBC teamed up with Patagonia Freeport, Kevin Browne Architect Associates, the University of Maine, and the Harpswell community in an effort to clean up the bay following a winter and spring of record storms. This was made possible with support from the Casco Bay Estuary Partnership and our volunteers.
If you would like to schedule a clean up event with your organization, email us at office@quahogbay.org!
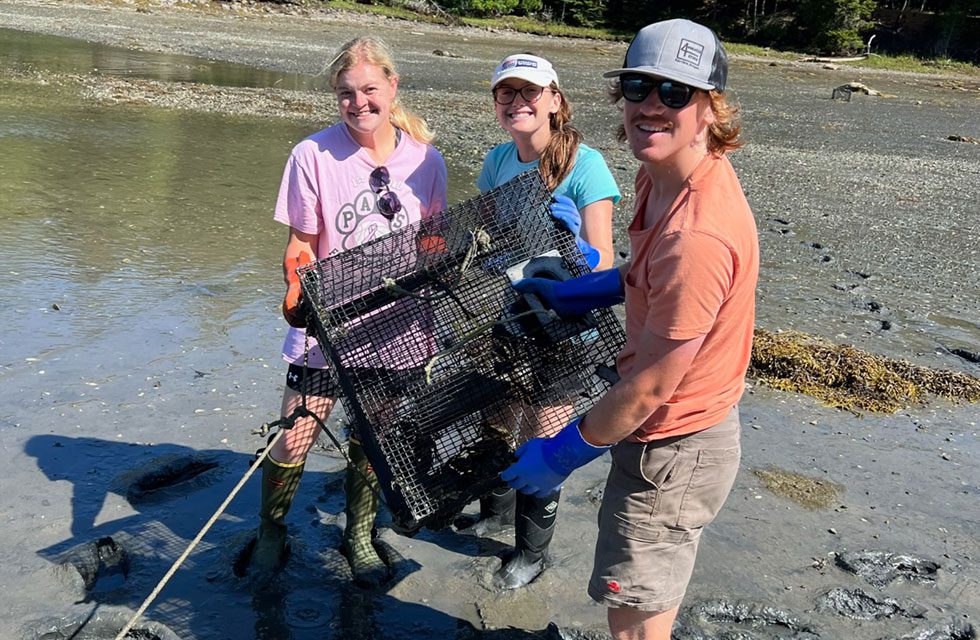
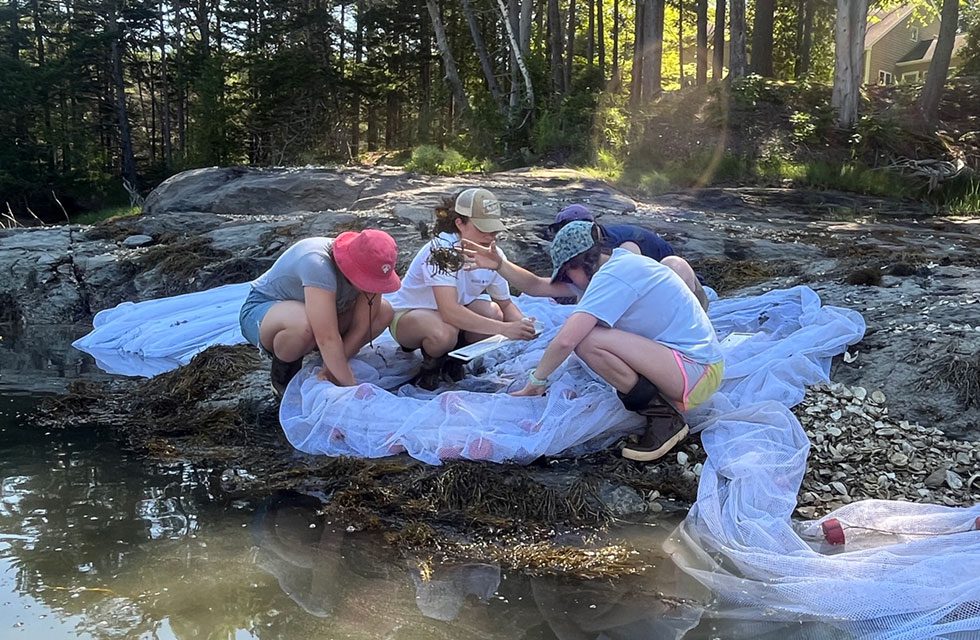
INVASIVE SPECIES REMOVAL
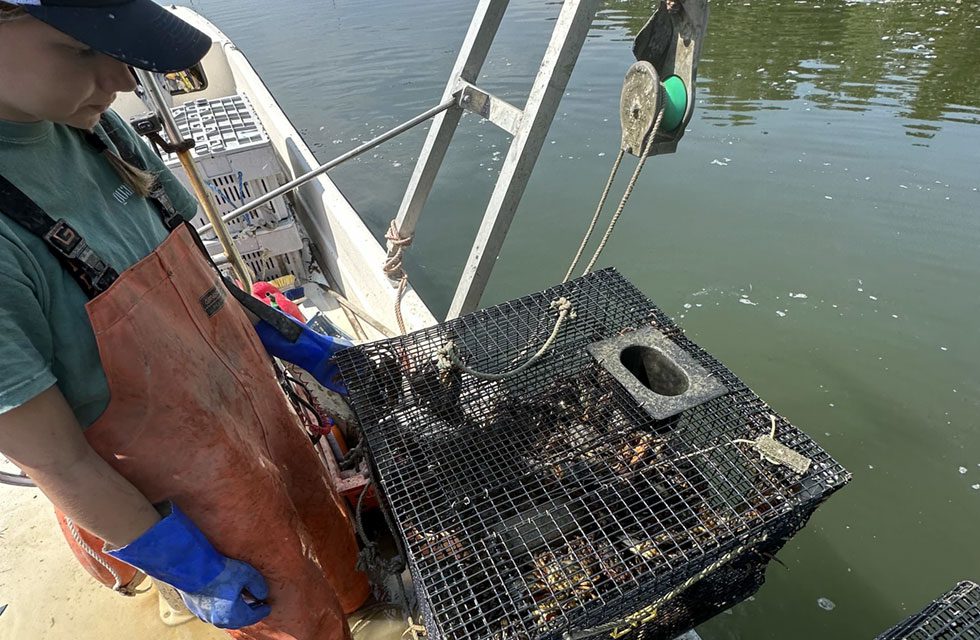

Green Crab Harvesting Sites
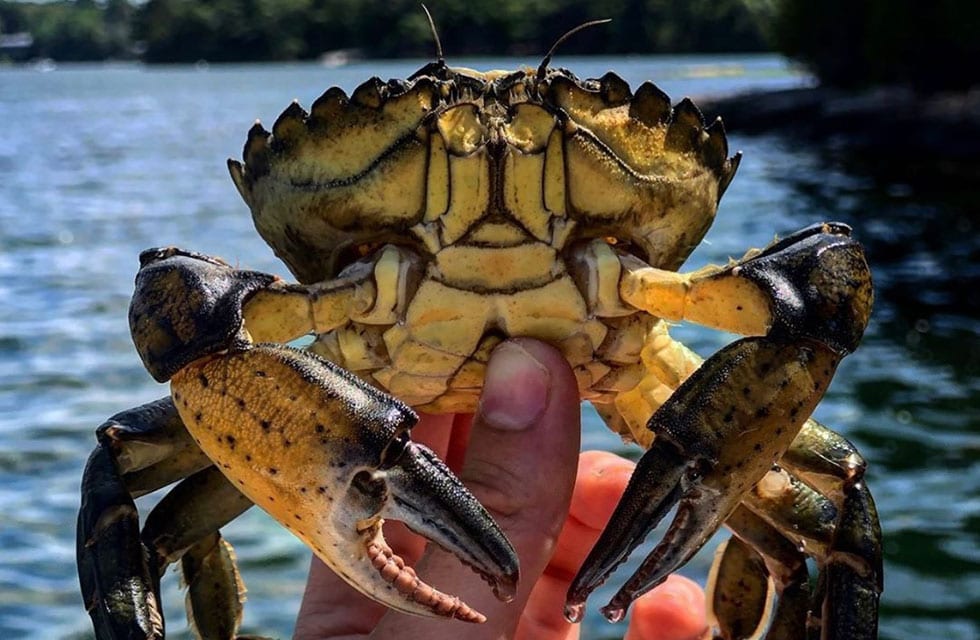
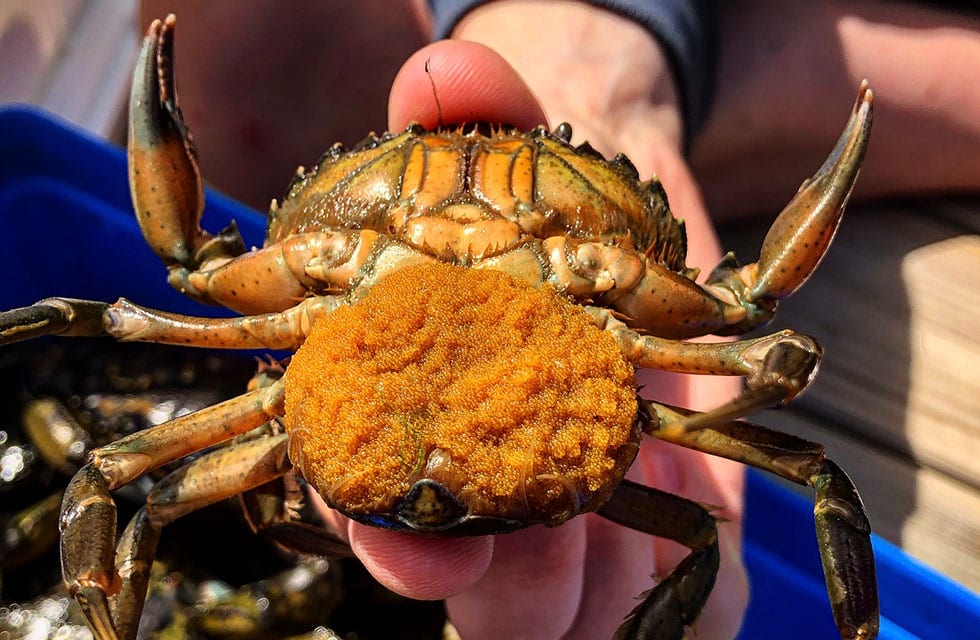
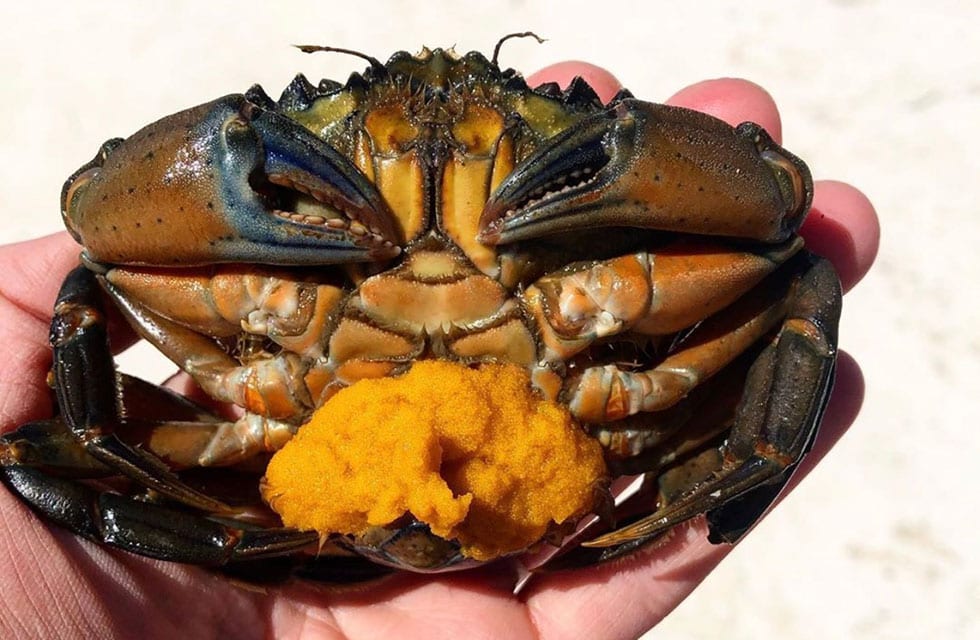
The European green crab (Carcinus maenas) is one of the most aggressive invasive predators in coastal marine systems, having established itself on every continent except Antarctica. The green crab came to the Atlantic coast of North America nearly 200 years ago, and today is one of the most ecologically and economically damaging predators. Our cold waters had kept their population in check, but now, with the Gulf of Maine warming 99% faster than any other world ocean, the green crab populations have rapidly expanded in size and range.
Green crabs consume nearly everything in their paths, destroying mussel beds, clam flats, and scallop stocks. This has devastating impact on local fishers who depend on shellfish production for their livelihood. In addition, green crabs slice through eelgrass habitat and burrow in salt marshes, causing increased erosion in bays and estuaries.
As the forces of climate change continue to amplify this threat, new strategies are needed to mitigate its ecological and socioeconomic impacts. QBC has developed a localized management plan that investigates and collects data on green crab population dynamics. We will use that information to increase our catch per unit effort (CPUE) and learn more about the species. Our management plan includes a) Prevention and Containment; b) Detection and Forecasting; c) Removal, Control, and Mitigation; and d) Data Management and Education.
QBC’s management plan takes a three-phase approach that aims to solve the green crab crisis.
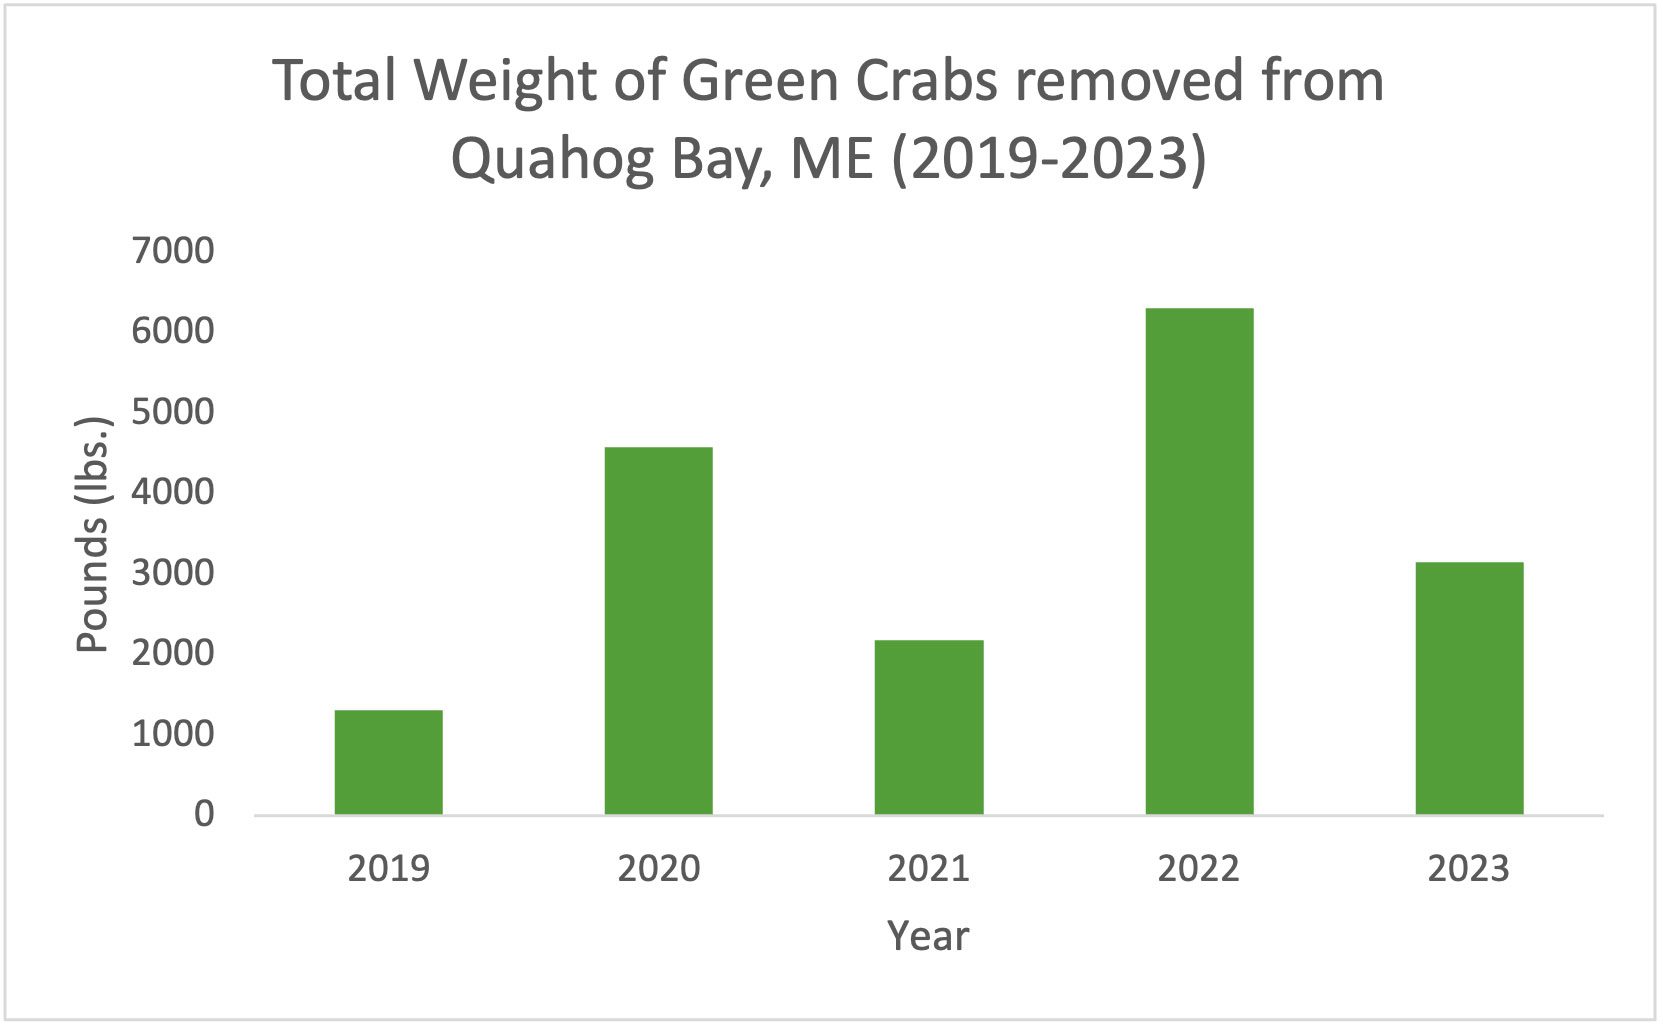
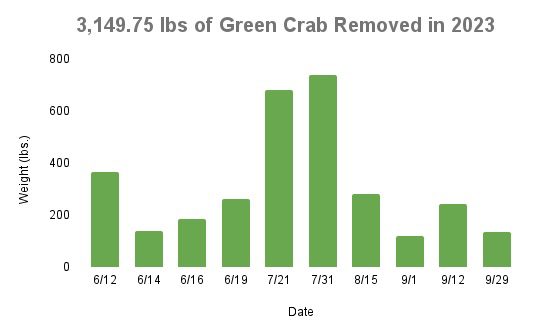
Phase I: Remove Green Crabs. It is highly unlikely that we will ever be able to eradicate them entirely. Yet, to alleviate the pressure that green crabs have put on our ecosystem, we want to remove as many as we can. As the largest green crab harvester in Maine, QBC has developed harvesting methods that remove thousands of pounds of green crab each year.
Phase II: Research Green Crabs. We collect data every time we fish for green crab. We track their abundance in Quahog Bay and population trends from May through November, creating a database for monitoring year to year.
Phase III: Develop a Lucrative Fishery. Our goal is to create a viable product that would provide a new source of economic opportunity for fishers and coastal communities. Utilizing an invasive species to diversify fisheries’ resources may ultimately enhance the future resiliency of Maine’s coastal communities. This could serve as a model for how to mitigate and adapt to the ecological and socioeconomic impacts of climate-driven change.
QBC has partnered with local fishers to investigate the viability of green crab as a fertilizer. We are partnering with businesses and other stakeholders in our marine ecosystem to identify and develop other ideas for eradicating the green crab.
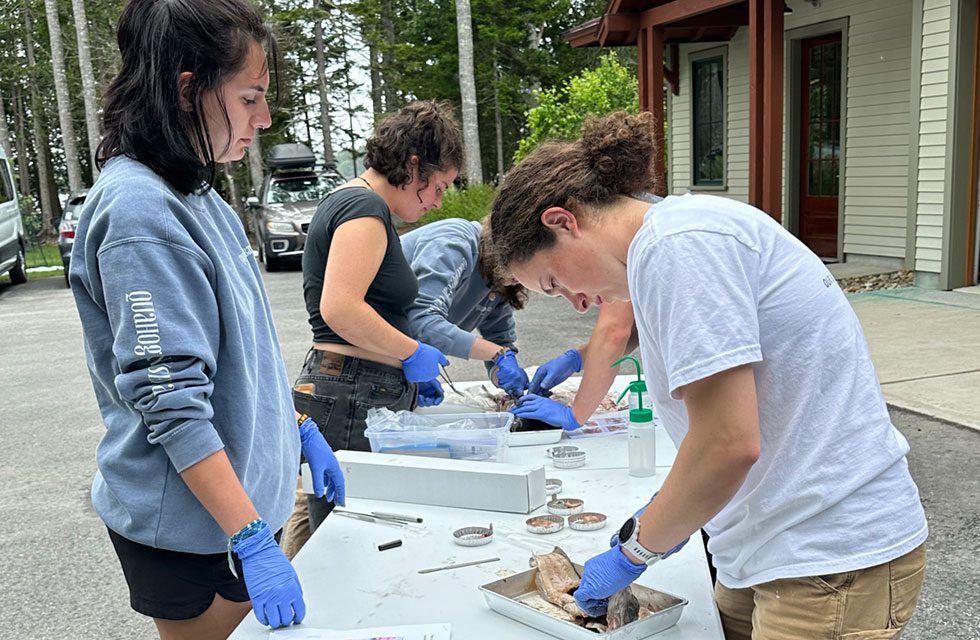
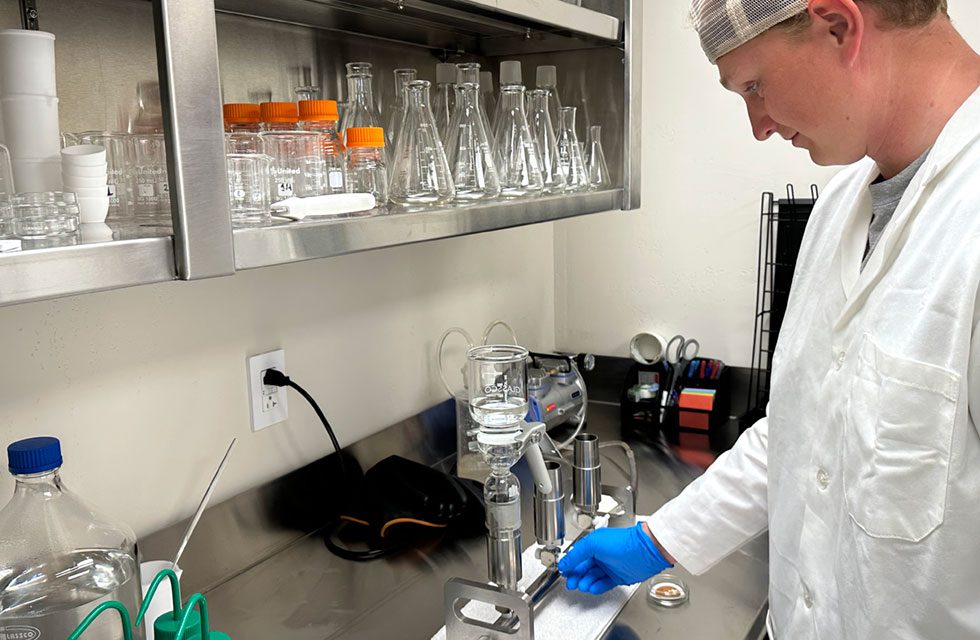
MICROPLASTICS
In 1907, the first fully-synthetic polymer resin,“Bakelite,” launched a mass production of plastics. Soon after, researchers created polystyrene and vinyl and by 1930, nylon. During World War II, the manufacturing of plastics increased for combat materials such as helmets, water resistant vinyl raincoats, and parachutes. With low production cost and versatility, the production of plastics revolutionized access to affordable consumer goods. Globally, plastics have improved safety, enhanced electronics, and transformed industries such as health and construction.
However, their mass production and degradation threatens our natural world.
Worldwide, over eight billion metric tons of plastic have been produced since 1862. While a mere 9% have been recycled and 12% have been incinerated, the remaining 79% of plastics amass in landfills or end up in rivers, streams, and oceans. Many everyday activities release microplastics into the environment. For example, while driving, tires can release small plastic particles into our atmosphere.
Plastic is a general term referring to synthetic material that can be molded into a variety of products under heat and pressure. All plastics are polymers (not all polymers are plastics), which are a class of natural or synthetic substances made up of very large molecules bonded together.
Microplastics are small pieces of plastic less than 5mm in size.
Primary microplastics are tiny particles designed for commercial use. Nurdles, spherical plastic pellets used in plastic production, are a common form of primary microplastics.
Secondary microplastics are plastic fragments derived from the breakdown of larger plastics. Styrofoam is a common source of secondary microplastics.
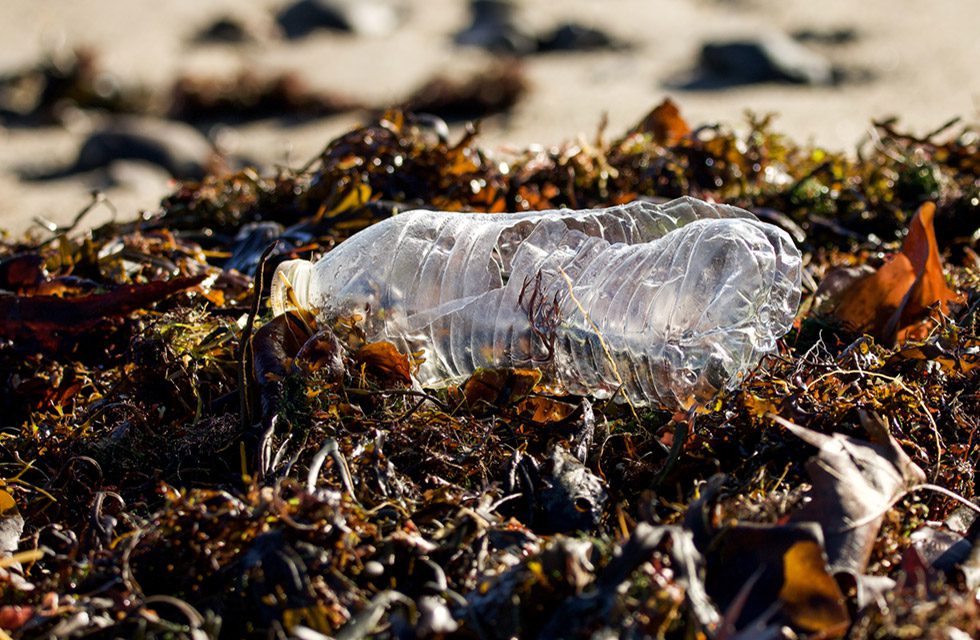
Macroplastics are large pieces of plastic more than 0.5cm in size. A plastic water bottle and a lost balloon are both examples of macroplastics.
Nanoplastics are plastic particles between 1 and 1000 nanometers in size. Generally, they are unintentionally produced via degradation and manufacturing.
Microfibers are microplastics with a diameter of less than 10 µm. They are often released into the environment from synthetic clothing.
TERMINOLOGY
Polyethylene Terephthalate (PETE) is the chemical name for polyester. It’s used in fibers for clothing, containers for liquids and foods, and much more. Important characteristics – strength, thermo-stability, gas barrier properties, transparency, lightweight, shatter-resistant, recyclable.
High Density Polyethylene (HDPE) is a form of polyethylene that is used to manufacture milk and juice bottles, buckets, crates, and bins.
Polyvinyl Chloride (PVC) is a synthetic polymer of plastic that comes in rigid and flexible forms. Rigid PVC is used in construction for pipe and in profile applications such as doors and windows. It is also used in making plastic bottles, packaging, and credit cards. In its flexible form, PVC is used in plumbing, electrical cable insulation, imitation leather, flooring, signage, and inflatable products.
Low Density Polyethylene (LDPE) is the second highest produced plastic. It is translucent, flexible, and water-resistant. These properties make it suitable for shopping bags and other plastic film products.
Polypropylene (PP) is soft and flexible with a high melting point. This is the highest produced type of plastic globally. It is used for food packaging, water bottles, and furniture fabrics.
Polystyrene (PS) is what styrofoam, packing peanuts, meat trays, and insulation are made of. This type of plastic is not recyclable.
Other Plastics: #7 plastics are a miscellaneous group that consists of acrylic, poly-carobnate, fiberglass, and polyamide (nylon.) Some #7 items can be recycled and others cannot so it is important to pay attention to item labels.
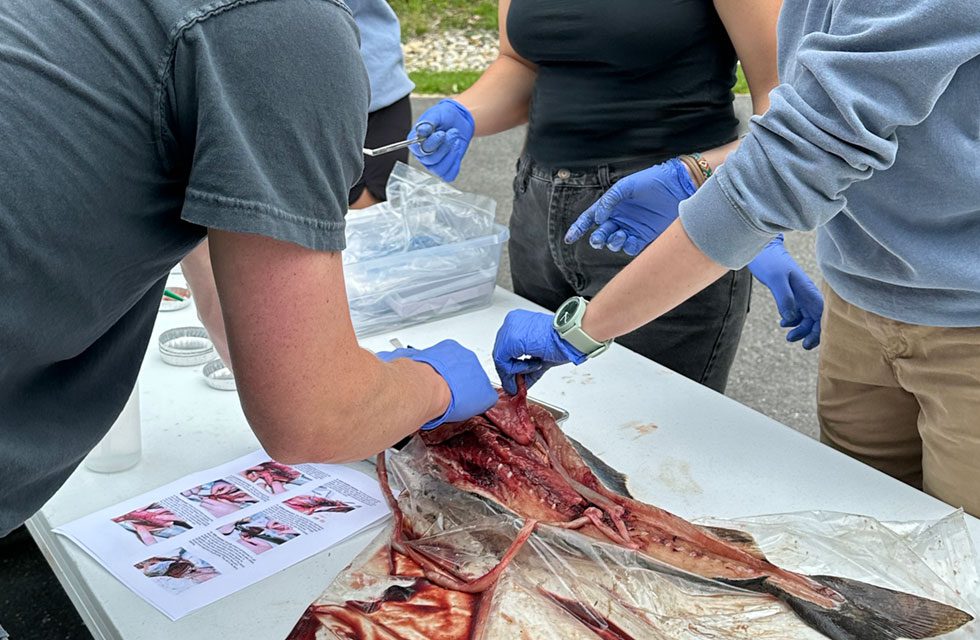
Approximately 30 years after the mass production of plastics, fishermen and scientists began to notice microplastics in the oceans. Decades later, we have begun to study the harmful effects of plastic pollution in Quahog Bay. Although the community has made great strides in plastic pollution research, we have yet to fully understand the effects on marine ecosystem health.
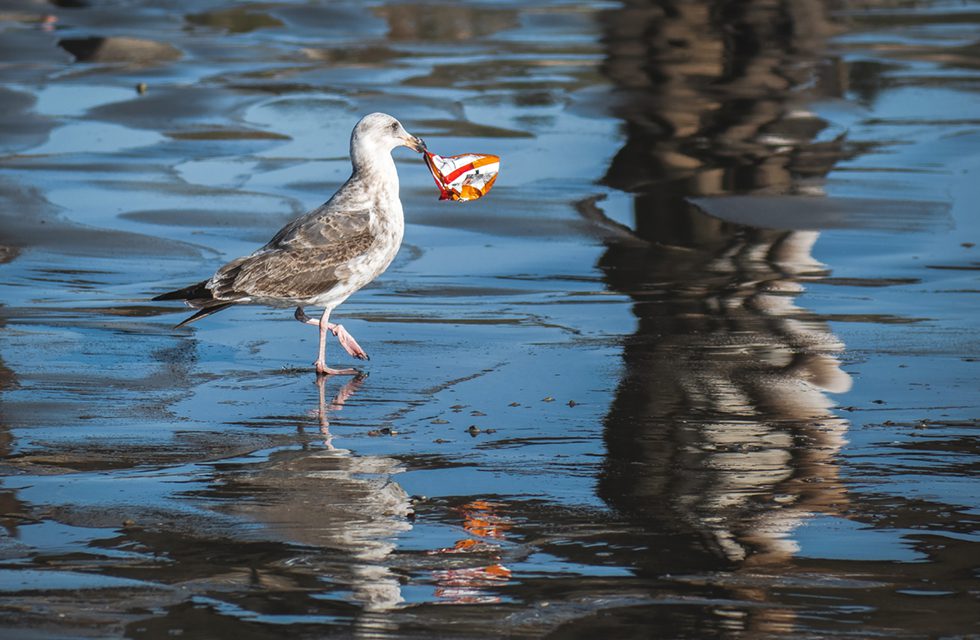
Plastic is an absorbent material, allowing harmful toxins and invasive species to be carried on its surface. The transportation and storage of toxic chemicals on microplastics can be particularly harmful to organisms that ingest these plastics. The ingestion of these plastics can lead to negative effects such as reduced food intake leading to starvation, delayed growth, or abnormal behavior. Invasive species can establish the plastic as a habitat which is then carried by ocean currents into new communities. The invasive species can then take over this new community, which can harm other species native to that community.
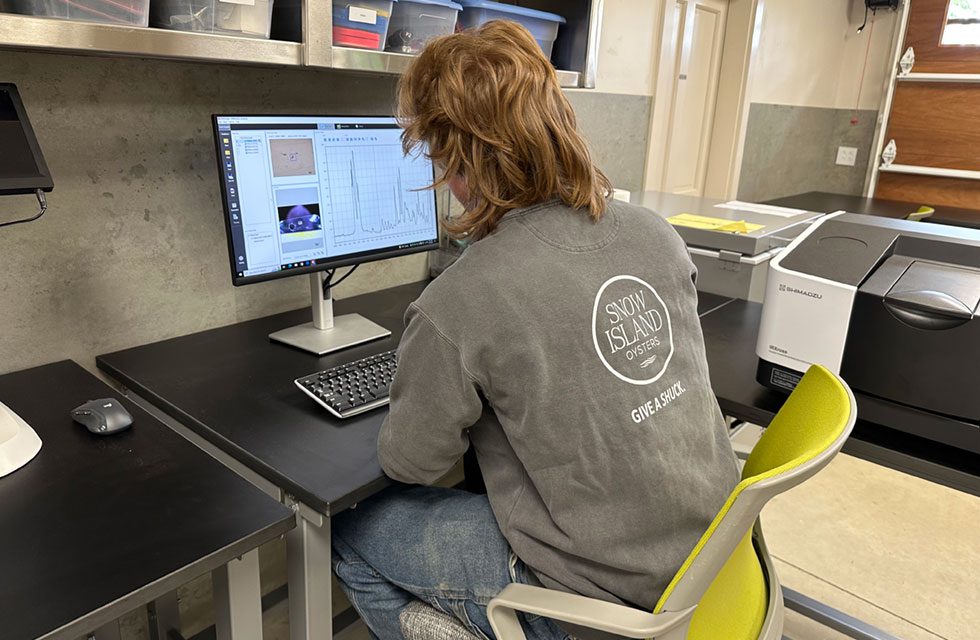
OVERVIEW
Molecular spectroscopy is the measurement of interactions between electromagnetic waves and matter to produce an absorption pattern that reveals structural or compositional information (including ions and molecules). Spectroscopy is used as a tool for studying the structures of atoms and molecules. Molecular Spectroscopy analytical software collects and analyzes data from a spectrophotometer, turning data into meaningful results.
Spectroscopy is the study of the absorption and emission of light and other radiation by matter. It involves the splitting of light (or more precisely, electromagnetic radiation) into wavelengths (a spectrum), like a prism that splits light into a rainbow of colors.
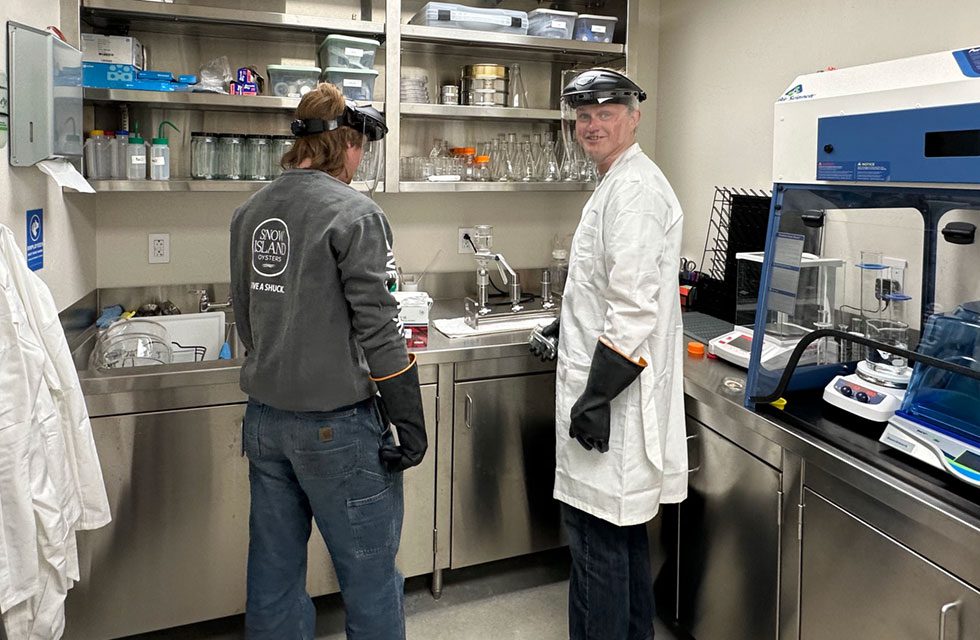
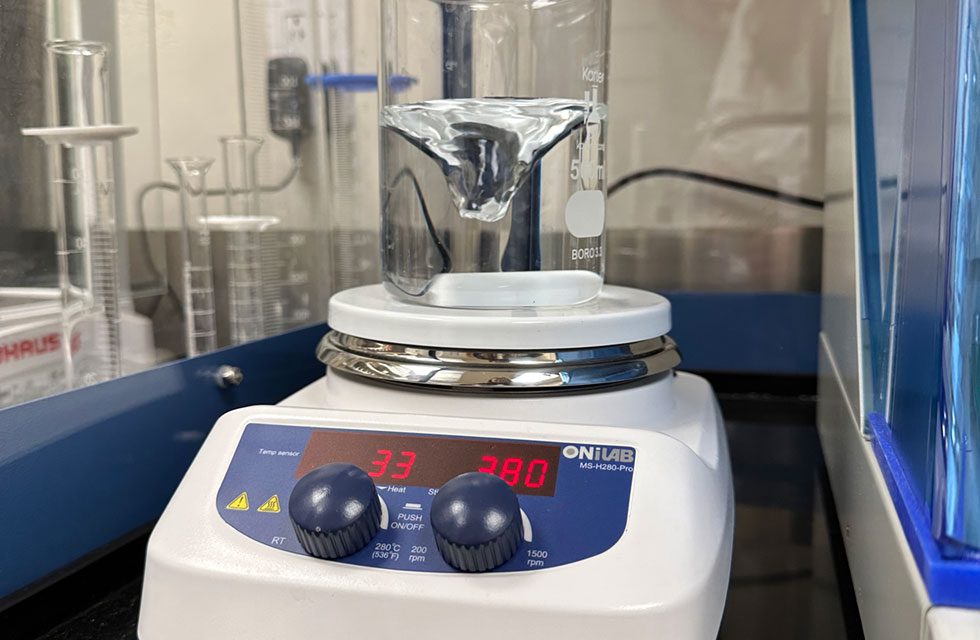
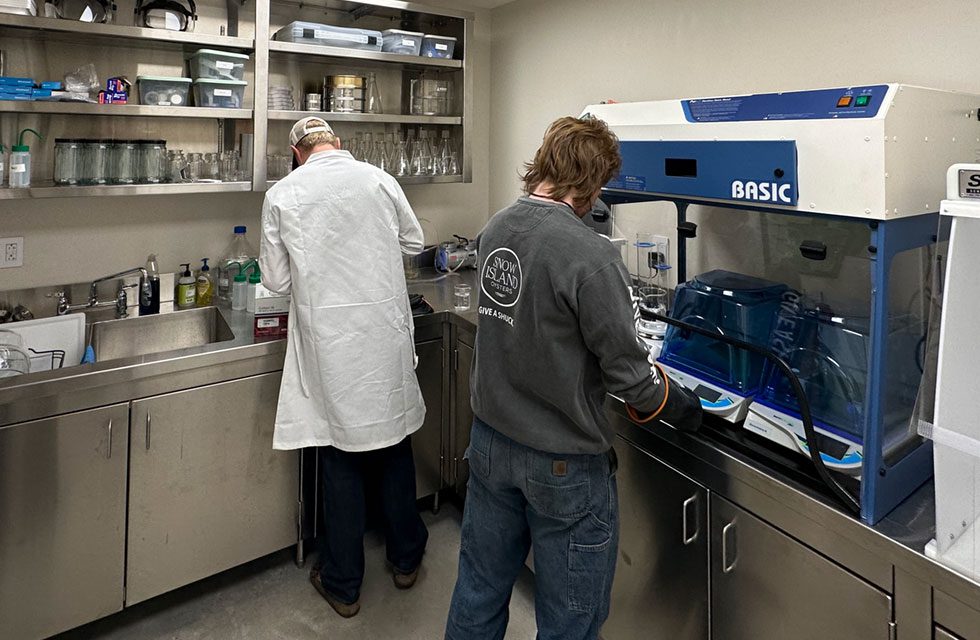
PROCESS
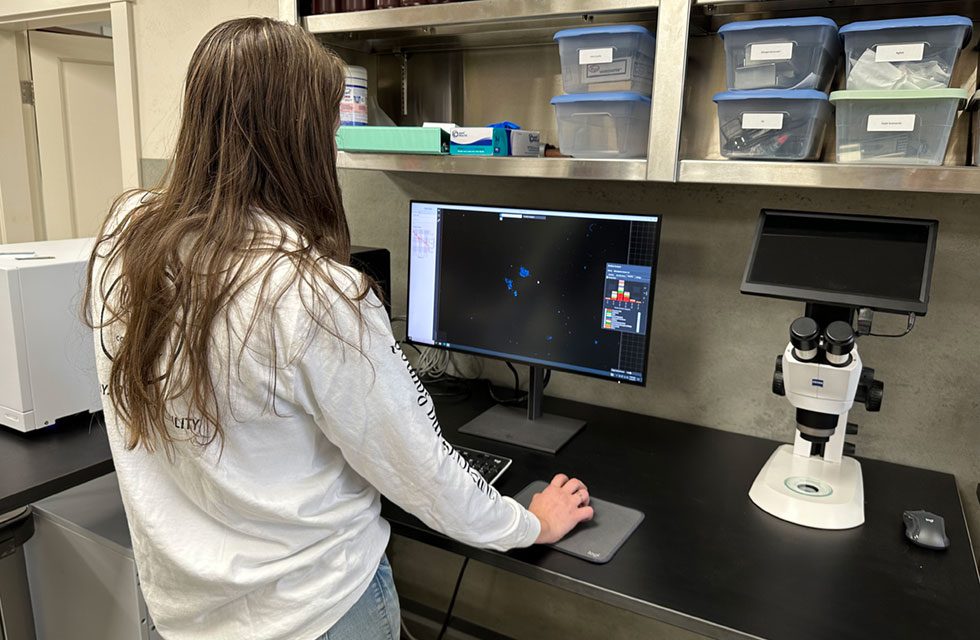
Laser Direct Infrared (LDIR) imaging provides a rapid and simplified path to molecular imaging using a quantum cascade laser (QCL) coupled with rapidly scanning optics. The Agilent 8700 LDIR chemical imaging system provides high-quality imaging and spectral data using IR light rather than visible cameras to determine the location, size, and shape of particles. Ideally suited to the analysis of microplastics.
Spectroscopic techniques, such as infrared (IR) can provide detailed information about individual particles (size, shape, chemical identity, etc.). Microscopes used for spectroscopy only measure two dimensions of a particle, the length and width. Spectroscopic techniques provide the user with complementary information for complete characterization of microplastics.
LDIR eliminates the need to collect data in empty spaces resulting in significantly faster analysis times and it can also be fully automated. A QCL operates at lower power than lasers, hence fluorescence and sample damage pose no risk.
- Observe — The quantum cascade laser scans the area for particle location using IR rather than visual light for particle detection.
- Measure — Detect the smallest particles (10 μm) of any IR systems without liquid nitrogen.
- Analyze — Obtain particle spectra much faster than FTIR (1 second compared to 30 seconds).
For more information on Agilent: https://www.agilent.com/en/product/molecular-spectroscopy/ldirchemical-imaging-spectroscopy
WHAT CAN YOU DO TO HELP?
1. Reduce and Reuse
Limiting the consumption of single use plastics is one of the most beneficial things you can do to prevent plastic from ending up in our environment. Switching to the reusable version of single use plastic items such as shopping bags, takeout containers, produce bags, utensils, water bottles, and straws will help cut down on the production and pollution of plastics.
2. Recycle
In addition to reducing and reusing, recycling plastics also makes a difference. When recycling plastics, make sure to check with your local recycling center to see what types of plastics they can recycle. Make sure your plastic is clean and dry before taking it to the recycling center to avoid it being discarded as trash.
3. Spread the word
You can help by sharing your knowledge about the effects of microplastics and the necessary steps to care for our environment with other people. This can be done by posting on social media, having conversations with friends, and volunteering in a local beach or neighborhood clean up. While one person’s initiative to limit their plastic use can improve the health of our ecosystem, the effort of a community creates a more impactful change.
4. Donate!
Find local organizations that work to create meaningful change for the health of our environment. Donate, volunteer, and attend events!